Dashboards
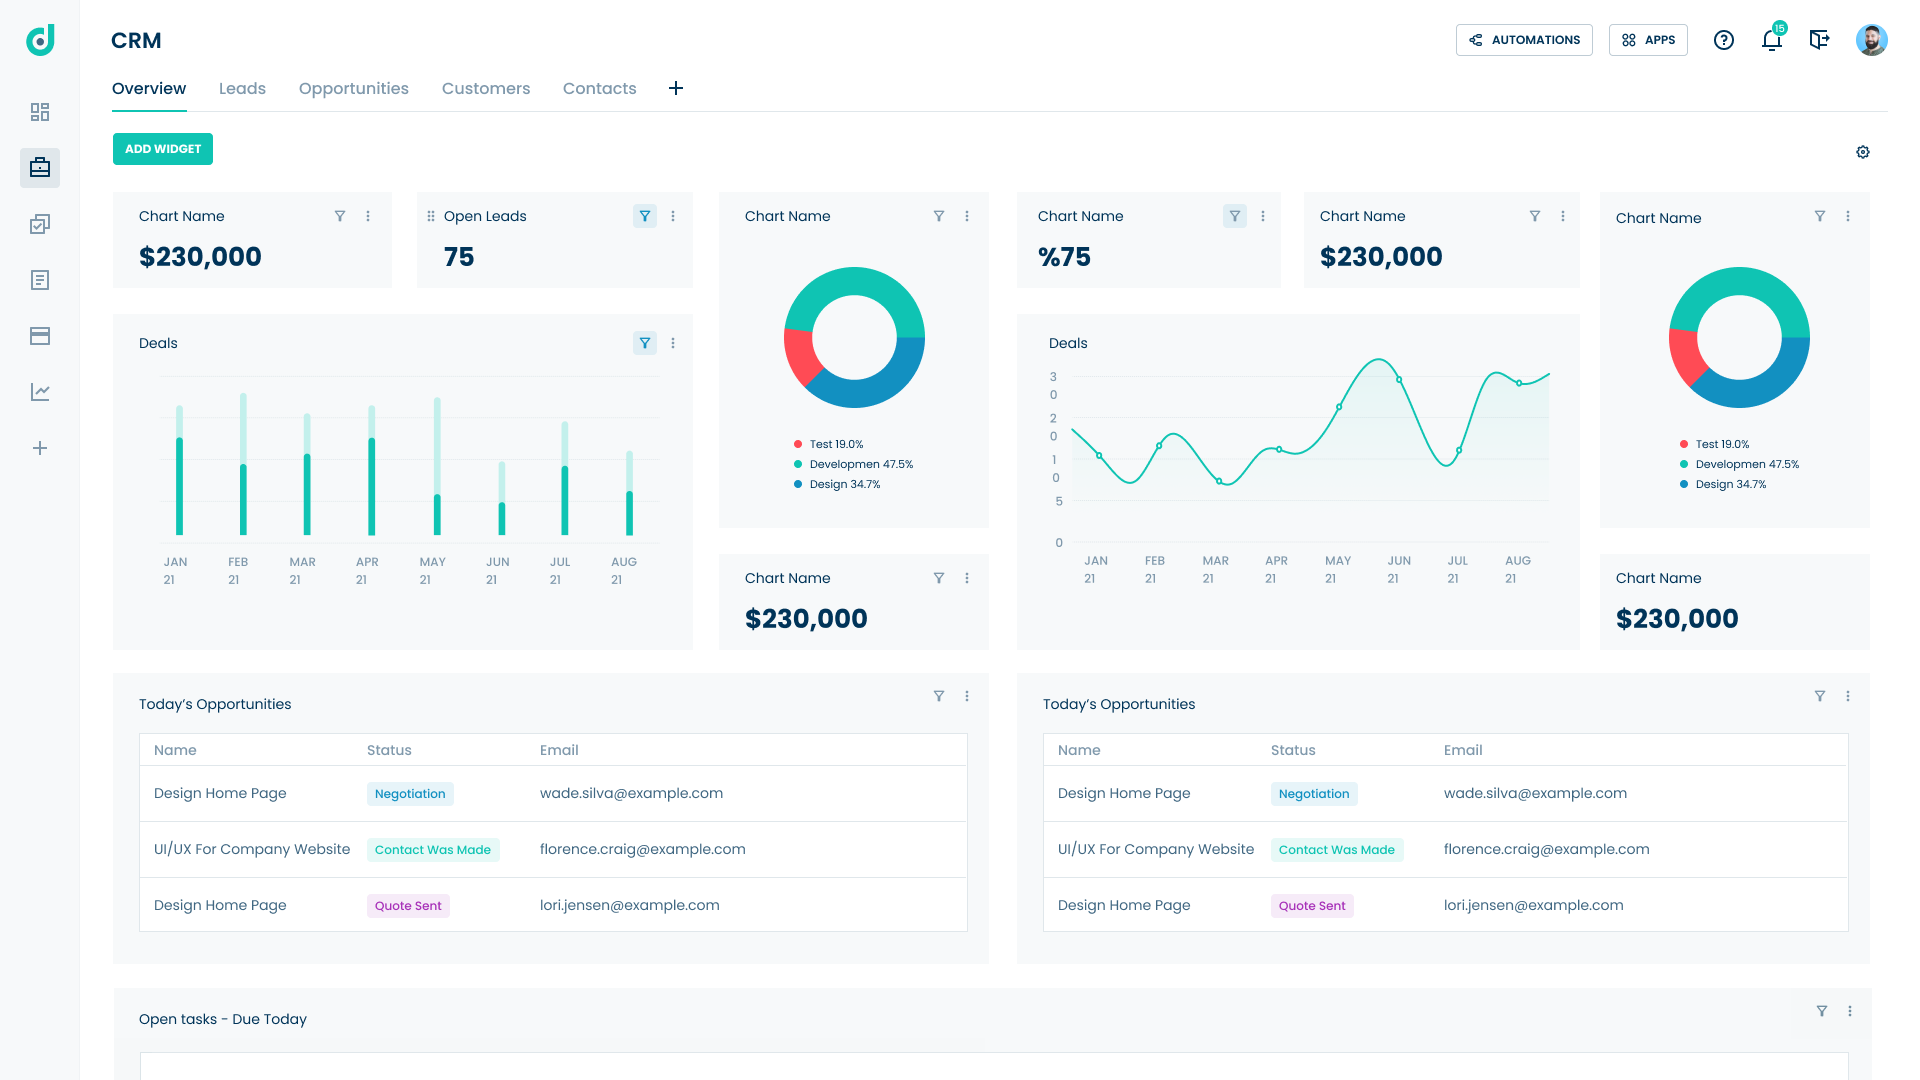
OneDeck's Dashboards feature is an essential tool for businesses that need to gain insights into their projects and workspaces. With our powerful analytics and reporting capabilities, businesses can quickly and easily monitor the progress of their projects, identify trends, and make data-driven decisions.
OneDeck's Dashboards feature provides businesses with easy-to-read graphs and charts that summarize key performance metrics, such as project status, task progress, and team performance. This information is presented in real-time, allowing businesses to make informed decisions quickly and efficiently.
OneDeck's Dashboards feature is highly customizable, allowing businesses to create custom dashboards and reports to track the specific metrics that are most important to them. This feature also includes the ability to filter data by team member, workspace, or project, making it easy for businesses to focus on the data that is most relevant to them.
One of the benefits of using OneDeck's Dashboards feature is that it allows businesses to identify trends and patterns in their data, which can help them make strategic decisions about their projects and workflows. For example, businesses can use this feature to identify bottlenecks in their workflows, forecast future project milestones, and track the performance of individual team members.
In summary, OneDeck's Dashboards feature provides businesses with a comprehensive view of their projects and workspaces, allowing them to monitor progress, track performance, and make informed decisions. With easy-to-read graphs and analytics, businesses can quickly identify trends, and make data-driven decisions. This feature is highly customizable, allowing businesses to tailor their dashboards and reports to their specific needs. Try OneDeck's Overviews feature today and see how it can help your business achieve greater success.


 Leads & opportunities